What Poker Database Software Reveals About Professional Player Performance Metrics
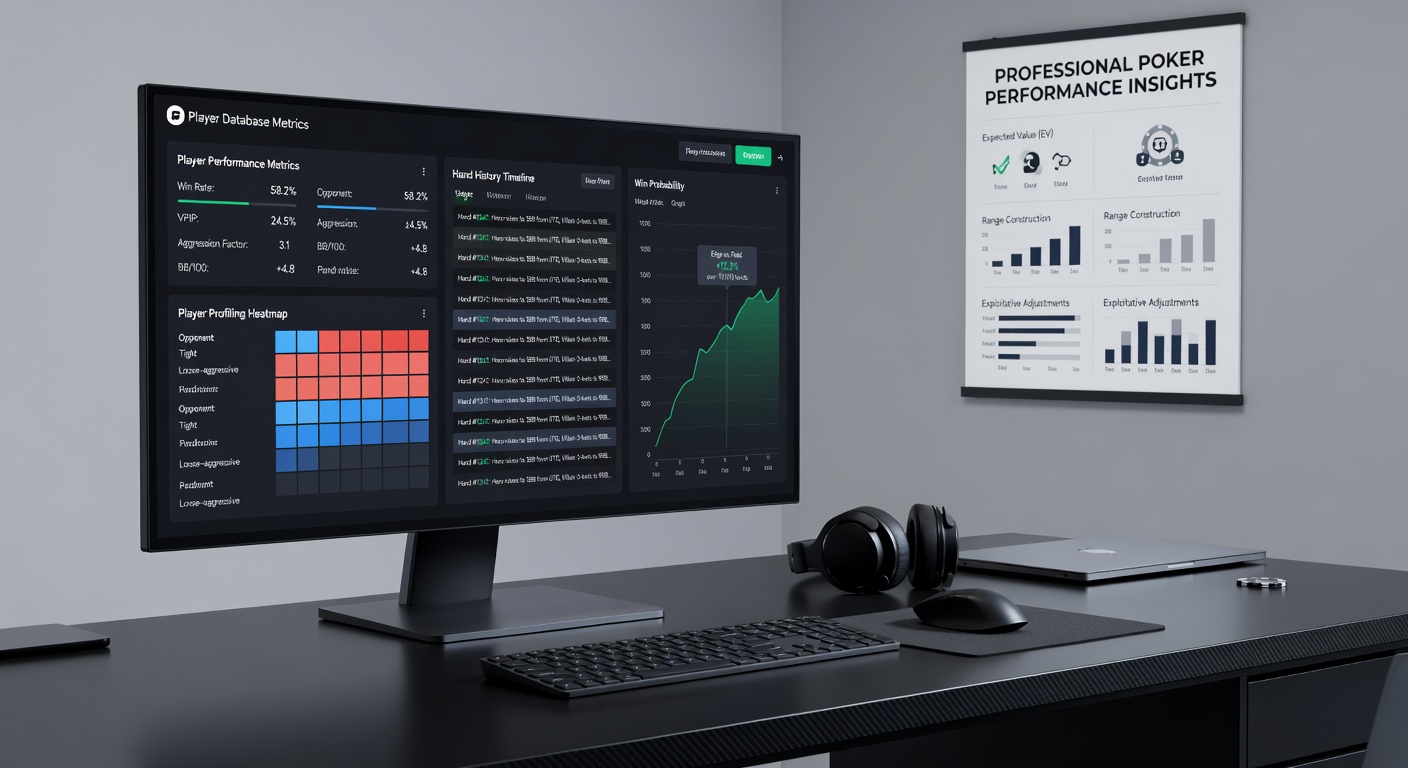
 Poker database software tracks hand histories from online platforms and organizes them into searchable records that show patterns across tens of thousands of hands. Programs such as PokerTracker and Hold'em Manager pull raw data on actions like calls, raises, and folds then calculate standardized statistics that allow observers to compare one player against established benchmarks.
Core Metrics That Define Playing Styles
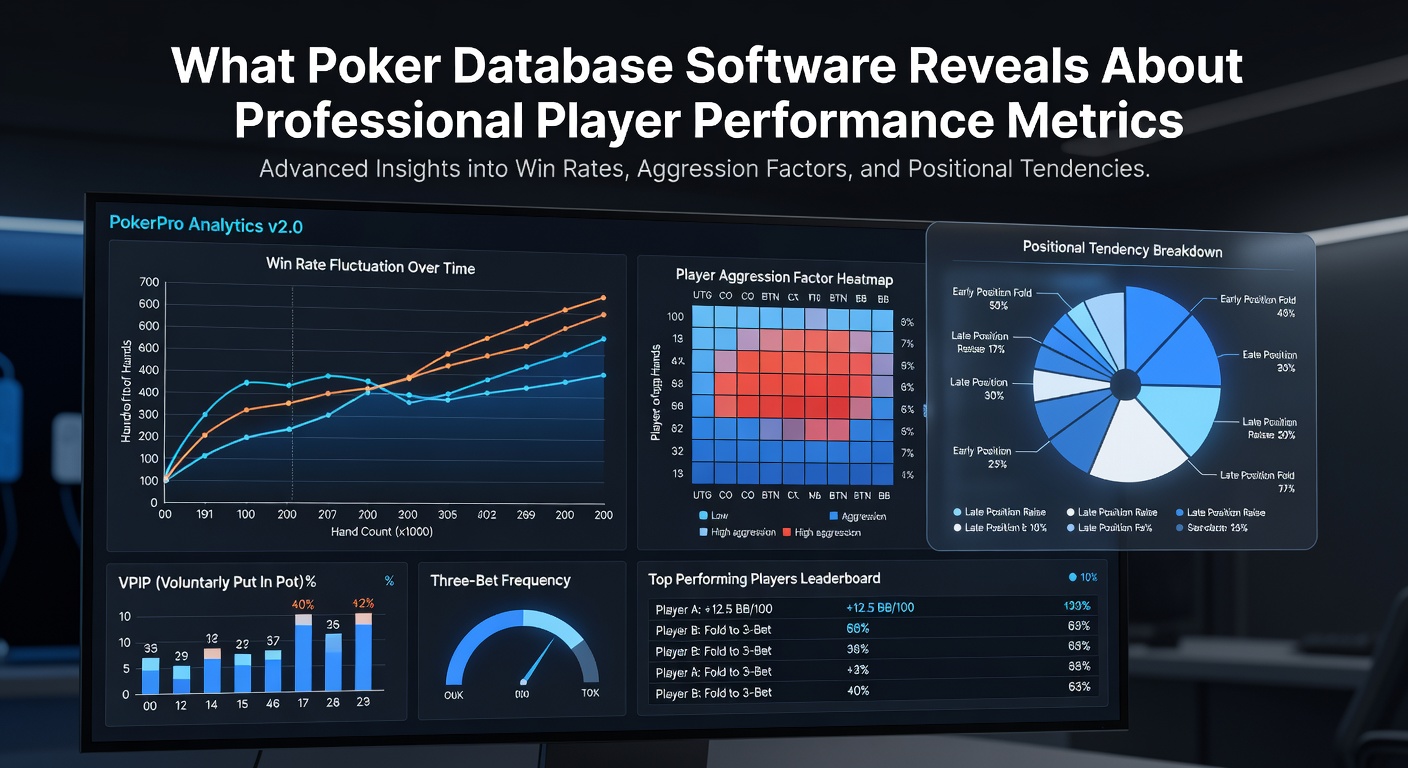
Voluntarily Put Money Into Pot percentage measures how often a player enters a hand without being forced by the blinds, while Pre-Flop Raise percentage tracks aggressive opening actions. Research indicates that professional players typically maintain VPIP ranges between 18 and 24 percent paired with PFR figures from 15 to 20 percent, creating the tight-aggressive profile common in high-stakes games. Aggression Factor further refines this picture by dividing aggressive actions by passive ones, and data shows top performers often post AF values above 3.0 in post-flop spots.
Went to Showdown and Won at Showdown percentages reveal how frequently players reach the river and convert those situations into wins. Professionals frequently record WTSD rates near 28 percent with W$SD figures above 52 percent, indicating selective hand defense combined with strong showdown value. These numbers emerge only after database software aggregates enough volume to smooth out short-term variance, which usually requires at least 30,000 hands for meaningful conclusions.
Win Rate Benchmarks Across Stake Levels
Big blinds won per 100 hands serves as the primary profitability gauge. Database records compiled through 2025 demonstrate that winning professionals at mid-stakes generate 4 to 7 bb/100 over large samples, whereas nosebleed players often sustain 2 to 4 bb/100 because of tougher competition and rake structures. Software filters allow users to isolate specific game types, such as 6-max versus full-ring, and reveal that 6-max specialists post slightly higher win rates due to increased volume and positional advantages.
Three-bet and four-bet percentages add another layer of insight. Professionals frequently three-bet 8 to 12 percent of opportunities and maintain polarized four-bet ranges that keep opponents guessing. Database queries tracking these frequencies across multiple sessions highlight how adjustments occur in response to table dynamics, with successful players increasing three-bet frequency against loose opponents while tightening against regulars.
Positional and Hand-Selection Insights
Database software breaks down statistics by position, exposing how professionals exploit late-position advantages. Steal percentages from the cutoff and button often exceed 35 percent for elite players, while fold-to-three-bet rates from the blinds stay below 70 percent. These positional splits become visible only when software tags every hand with seat information and aggregates results over extended periods.
Hand-selection heat maps generated by the programs illustrate which starting hands produce positive expected value at each stake level. Evidence from aggregated professional datasets indicates that suited connectors and small pairs retain profitability primarily in late position, whereas premium pairs and strong aces remain profitable from early seats. Players who review these maps regularly adjust opening ranges accordingly, and the software records those adjustments as shifts in VPIP and PFR over time.
Trends Observed Through May 2026
Updates released in early 2026 added real-time HUD customization and deeper multiway pot filters, allowing professionals to monitor evolving table tendencies more precisely. Records from the first four months of 2026 show a modest uptick in reported win rates at lower stakes, coinciding with increased recreational traffic on major sites. Database comparisons between 2024 and 2026 cohorts reveal that professionals who incorporated solver-derived ranges into their tracked play maintained steadier aggression metrics despite rising rake percentages at certain limits.
According to figures released by the Nevada Gaming Control Board, online poker handle in regulated markets grew steadily through spring 2026, supplying larger hand samples for database analysis. This increased volume sharpens statistical reliability and helps identify subtle leaks that remain hidden in smaller datasets.
Conclusion
Poker database software converts millions of individual decisions into clear performance indicators that separate consistent winners from breakeven or losing players. Metrics such as VPIP, PFR, aggression factor, and positional win rates provide objective benchmarks, while hand-history filters expose the precise adjustments that drive long-term profitability. As sample sizes expand and software features evolve, these tools continue to deliver granular visibility into the measurable elements of professional play.